Datascience24
Please message me using Send Message option for new assignment requests.
- 190
- 0
- 10
Community
- Followers
- Following
12 Reviews received
200 items
Information_Visualization_Week6_NEC_Solved
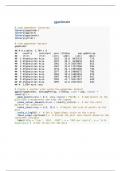
Create your own Gapminder animated gapminder plot using the attached tutorial. Submit an R Markdown file with all your code and your visualization. Comment your code line by line explaining what each function and each function parameter is for. Information_Visualization_Week7_NEC_Solved
- Book & Paket-Deal
- Exam (elaborations)
- • 5 pages •
Create your own Gapminder animated gapminder plot using the attached tutorial. Submit an R Markdown file with all your code and your visualization. Comment your code line by line explaining what each function and each function parameter is for. Information_Visualization_Week7_NEC_Solved
Information_Visualization_Week5_NEC_Solved
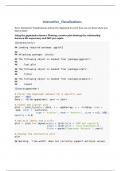
Using your own data, create three interactive visualizations using plotly.
- Book & Paket-Deal
- Exam (elaborations)
- • 3 pages •
Using your own data, create three interactive visualizations using plotly.
Information_Visualization_Week5_NEC_Solved
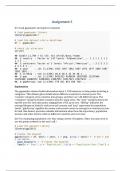
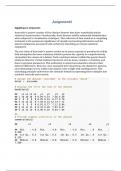
Experiment with the gapminder data to practice some of the new geoms we have learned. Try examining population or life expectancy over time using a series of boxplots. (Hint: you may need to use the group aesthetic in the aes() call.) Can you facet this boxplot by continent? Is anything different if you create a tibble from gapminder that explicitly groups the data by year and continent first, and then create your plots with that? Comment your code line by line. Explain what your charts are show...
- Book & Paket-Deal
- Exam (elaborations)
- • 9 pages •
Experiment with the gapminder data to practice some of the new geoms we have learned. Try examining population or life expectancy over time using a series of boxplots. (Hint: you may need to use the group aesthetic in the aes() call.) Can you facet this boxplot by continent? Is anything different if you create a tibble from gapminder that explicitly groups the data by year and continent first, and then create your plots with that? Comment your code line by line. Explain what your charts are show...
Information_Visualization_Week4_NEC_Solved
Participate in Andy Kriebel’s Makeover Monday Project ( Andy Kriebel’s makeover Monday dataset is published every Sunday. Use any Sunday dataset and create a makeover of the chart using the provided data. Explain the difference in your plot. Comment your code line by line and explain what the charts are showing. Submit an R Markdown.
- Book & Paket-Deal
- Exam (elaborations)
- • 8 pages •
Participate in Andy Kriebel’s Makeover Monday Project ( Andy Kriebel’s makeover Monday dataset is published every Sunday. Use any Sunday dataset and create a makeover of the chart using the provided data. Explain the difference in your plot. Comment your code line by line and explain what the charts are showing. Submit an R Markdown.
Information_Visualization_Week3_NEC_Solved
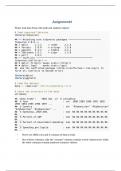
Create a scatter plot of gdp v life expectancy for five countries over a period of years. Show each country in a different color. Add a trend line. Comment your code line by line. Explain in a paragraph of at least five sentences what the chart is showing. Submit an R Markdown file with interpretations of each chart. Do not copy. Your work should be your own Your writing should be in your own words.
- Book & Paket-Deal
- Exam (elaborations)
- • 9 pages •
Create a scatter plot of gdp v life expectancy for five countries over a period of years. Show each country in a different color. Add a trend line. Comment your code line by line. Explain in a paragraph of at least five sentences what the chart is showing. Submit an R Markdown file with interpretations of each chart. Do not copy. Your work should be your own Your writing should be in your own words.
Information_Visualization_Week2_NEC_Solved
Create Anscombe's quartet of visualizations. Comment your code line by line. Explain the significance of the Quartet. Why do we include it in our studies? Submit an R Markdown file that includes an interpretation of every visualization you provide.
- Book & Paket-Deal
- Exam (elaborations)
- • 6 pages •
Create Anscombe's quartet of visualizations. Comment your code line by line. Explain the significance of the Quartet. Why do we include it in our studies? Submit an R Markdown file that includes an interpretation of every visualization you provide.
Information_Visualization_Week1_NEC_Solved
Install R and R studio and all the packages Healy requires. Add the package 'socviz' to the list provided and you can skip installing from githum. Explore R Studio. Highlight the different windows and tabs. Take screenshots of your work. Submit a Word document with those screenshots in it and explain each one.
- Book & Paket-Deal
- Exam (elaborations)
- • 2 pages •
Install R and R studio and all the packages Healy requires. Add the package 'socviz' to the list provided and you can skip installing from githum. Explore R Studio. Highlight the different windows and tabs. Take screenshots of your work. Submit a Word document with those screenshots in it and explain each one.
NetworkCommunications_NEC_All_7_Weeks_Quizzes_Solved
NetworkCommunications_NEC_All_Weeks_Quizzes_Solved
- Package deal
- • 10 items •
- Week_1_Task_4_Quiz_Q&S_NetworkCommunications • Exam (elaborations)
- Week_1_Task_6_Q&S_NetworkCommunications • Exam (elaborations)
- Week_2_Task_6_Q&S_NetworkCommunications • Exam (elaborations)
- Week_3_Task_4_Q&S_NetworkCommunications • Exam (elaborations)
- Week_3_Task_6_Q&S_NetworkCommunications • Exam (elaborations)
- And more ….
NetworkCommunications_NEC_All_Weeks_Quizzes_Solved
FinalExam_Q&S_NetworkCommunications
FinalExam_Q&S_NetworkCommunications
- Package deal
- Exam (elaborations)
- • 3 pages •
FinalExam_Q&S_NetworkCommunications

MidTerm_Q&S_NetworkCommunciations
MidTerm_Q&S_NetworkCommunciations - Week 5
- Package deal
- Exam (elaborations)
- • 10 pages •
MidTerm_Q&S_NetworkCommunciations - Week 5
Santander_Bank_Case_Study_ML_Week6_NEC
Drawing_Maps_VisualAnalytics_Week13_NEC_Solved
MNIST _Fashion_MNIST_image_data_ML_Wk12_NEC_Solved
Santander_Bank_Case_Study_ML_Week6_NEC
Fundamentals_of_ensemble_modeling_Week5_NEC