stat 200 (STAT200)
University Of Maryland - Baltimore
Page 3 out of 61 results
Sort by

-
SOPHIA INTRO TO STATS UNIT 1 MILESTONE 1 - UNIT 5 MILESTONE 5 BUNDLE
- Package deal • 4 items • 2021
- $30.49
- 1x sold
- + learn more
SOPHIA INTRO TO STATS UNIT 1 MILESTONE 1 - UNIT 5 MILESTONE 5 BUNDLE

-
Sophia Intro to Stats Unit 5 Milestone 5
- Exam (elaborations) • 22 pages • 2021
- $15.49
- + learn more
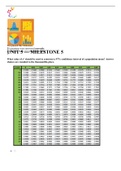
Sophia Intro to Stats Unit 5 Milestone 5.What value of z* should be used to construct a 97% confidence interval of a population mean? Answer choices are rounded to the thousandths place. 1.65 1.88 1.96 2.17 RATIONALE Using the z-chart to construct a 97% CI, this means that there is 1.5% for each tail. The lower tail would be at 0.015 and the upper tail would be at (1 - 0.015) or 0.985. The value of 0.9850 is actually on the z-table exactly. 0.9850 corresponds with a z-score of 2.17. CONCEPT Conf...
-
Sophia Intro to Stats Unit 5 Milestone 5
- Exam (elaborations) • 22 pages • 2021
- $16.49
- + learn more
Sophia Intro to Stats Unit 5 Milestone 5.What value of z* should be used to construct a 97% confidence interval of a population mean? Answer choices are rounded to the thousandths place. 1.65 1.88 1.96 2.17 RATIONALE Using the z-chart to construct a 97% CI, this means that there is 1.5% for each tail. The lower tail would be at 0.015 and the upper tail would be at (1 - 0.015) or 0.985. The value of 0.9850 is actually on the z-table exactly. 0.9850 corresponds with a z-score of 2.17. CONCEPT Conf...
-
Sophia Intro to Stats Unit 4 Milestone 4
- Exam (elaborations) • 23 pages • 2021
- $16.49
- + learn more
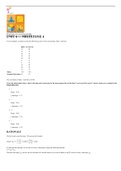
Sophia Intro to Stats Unit 4 Milestone 4.For ten students, a teacher records the following scores of two assessments, Quiz 1 and Test. Quiz 1 (x) Test (y) 15 20 12 15 10 12 14 18 10 10 8 13 6 12 15 10 16 18 13 15 Mean 11.9 14.3 Standard Deviation 3.3 3.5 The correlation of Quiz 1 and Test is 0.568. Given the information below, what is the slope and y-intercept for the least-squares line of the Quiz 1 scores and Test scores? Answer choices are rounded to the hundredths place. Slope = 0.54 y-inter...

-
Sophia Intro to Stats Unit 4 Milestone 4
- Exam (elaborations) • 23 pages • 2021
- $17.49
- 1x sold
- + learn more
Sophia Intro to Stats Unit 4 Milestone 4.For ten students, a teacher records the following scores of two assessments, Quiz 1 and Test. Quiz 1 (x) Test (y) 15 20 12 15 10 12 14 18 10 10 8 13 6 12 15 10 16 18 13 15 Mean 11.9 14.3 Standard Deviation 3.3 3.5 The correlation of Quiz 1 and Test is 0.568. Given the information below, what is the slope and y-intercept for the least-squares line of the Quiz 1 scores and Test scores? Answer choices are rounded to the hundredths place. Slope = 0.54 y-inter...

Too much month left at the end of the money?

-
Sophia Intro to Stats Unit 3 Milestone 3
- Exam (elaborations) • 15 pages • 2021
- $14.49
- + learn more
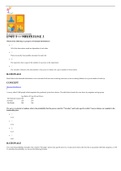
Sophia Intro to Stats Unit 3 Milestone 3.Which of the following is a property of binomial distributions? All of the observations made are dependent of each other. There are exactly four possible outcomes for each trial. The expected value is equal to the number of successes in the experiment. The variable of interest is the total number of successes or failures for a given number of observations. RATIONALE Recall that for the binomial distribution we are concerned with an event occurring (succes...

-
Sophia Intro to Stats Unit 3 Milestone 3
- Exam (elaborations) • 15 pages • 2021
- $15.49
- + learn more
Sophia Intro to Stats Unit 3 Milestone 3.Which of the following is a property of binomial distributions? All of the observations made are dependent of each other. There are exactly four possible outcomes for each trial. The expected value is equal to the number of successes in the experiment. The variable of interest is the total number of successes or failures for a given number of observations. RATIONALE Recall that for the binomial distribution we are concerned with an event occurring (succes...

-
Sophia Intro to Stats Unit 2 Milestone 2
- Exam (elaborations) • 19 pages • 2021
- $14.49
- + learn more
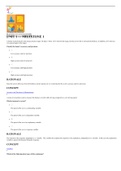
Sophia Intro to Stats Unit 2 Milestone 2.In which of these cases should the median be used? When the data has small variance When data has no outliers When the data has extreme values When the data has nominal values RATIONALE Since the mean uses the actual values in the data, it is most affected by outliers and skewness. So, we only want to use the mean when the data is symmetric as a measure of centrality. When the data is skewed or has extreme values, the median is a better measure since it i...

-
Sophia Intro to Stats Unit 2 Milestone 2
- Exam (elaborations) • 19 pages • 2021
- $15.49
- + learn more
Sophia Intro to Stats Unit 2 Milestone 2.In which of these cases should the median be used? When the data has small variance When data has no outliers When the data has extreme values When the data has nominal values RATIONALE Since the mean uses the actual values in the data, it is most affected by outliers and skewness. So, we only want to use the mean when the data is symmetric as a measure of centrality. When the data is skewed or has extreme values, the median is a better measure since it i...
-
Sophia Intro to Stats Unit 1 Milestone 1
- Exam (elaborations) • 13 pages • 2021
- $14.49
- + learn more
Sophia Intro to Stats Unit 1 Milestone 1.A hunter is practicing his aim using a practice target. He takes 5 shots. All 5 shots hit the target, but they do not hit or surround the bullseye. In addition, all 5 shots are very spread apart on the target. Classify the hunter's accuracy and precision. Low accuracy and low precision High accuracy and low precision Low accuracy and high precision High accuracy and high precision RATIONALE Since the arrows fall away from the bullseye and are spread out ...
